all Think Trillion Story
Think Trillion :: ‘Trillion Dollar Economy’/ ‘Trillion Dollar Company/Market/Potential’/ ‘Trillion Dollar Country’ or anything that implies the big figure ‘Trillion‘
Portray All Stories ON ‘Trillion Dollar Economy’/ ‘Trillion Dollar Company/Market’/ ‘Trillion Dollar Country’ or anything that implies the big figure ‘Trillion‘ as ‘Think Trillion Story’ here.
Add Story/ Your Say
[*Select Category/Tag: Think Trillion at Your Next Publish Screen.]

The Trillion Dollar Club | Comparisun


At Comparisun, we’re here to help you find the best POS system, the best credit card processing company or the best payroll service, but we’re also known to take the time to launch studies into the wider business sector every month.
Microsoft recently became the latest company to join Wall Street’s exclusive ‘Trillion Dollar Club’, after reaching a market capitalization of a trillion dollars in late April.
They join both Apple and Amazon, who have both seen great growth in recent years (although Amazon has slightly dropped below the $1 trillion threshold again at the moment).
And while no individuals are yet to amass a fortune of a trillion dollars, Jeff Bezos is the first to hit the $100 billion mark and could be the world’s first trillionaire sooner than you’d think.
We’ve analysed historical valuations of some of the world’s richest companies and individuals in an attempt to predict when they’ll join the Trillion Dollar Club.
Which companies will be the first to join the Trillion Dollar Club?
Google look set to join their fellow tech giants Apple and Microsoft in hitting the $1 trillion mark within the next year (as will Amazon, who have hit the threshold in the past but have briefly dropped out again).
The numbers suggest that they’ll soon be followed by the last of the Big Four tech companies, Facebook, whose market cap currently sits at around $665bn, but has seen an average growth of 24% over the last five years, which, if continued, could see them join the club in 2022.
Next in line would be Warren Buffet’s Berkshire Hathway conglomerate and financial services provider Visa who could both hit $1 trillion valuations by 2023.


Predicting the world’s first trillionaires
Despite losing an estimated $38 billion as part of his recent divorce, Jeff Bezos is still by far the world’s richest person and his net worth has grown by 34% on average over the last five years, which could potentially see him become the world’s first trillionaire as early as 2026, at which point he’ll be aged 62.
While he might have to wait a couple of extra years, Facebook founder Mark Zuckerberg could gain trillionaire status at a younger age than Bezos, as his current rate growth would see him worth $1 trillion aged 51.
Of the 25 individuals we analysed, only eleven realistically have a chance of becoming a trillionaire during their lifetime, based on their recent rate of wealth growth.


Methodology
We analysed the market capitalization of the 25 highest valued companies on the New York Stock Exchange according to Macrotrends, as well as the net worth of the richest 25 people in the world, according to Forbes, in both cases taking the last five years of data (as of September 16th).
For both, we then calculated the average yearly % growth over the last five years and applied this rate of growth for each future year to try and predict how the value will change.
Notes:
– For Google, Berkshire Hathaway and Royal Dutch Shell, who have each split their stocks into more than one group of shares, we took the one with the highest value as of September 16th.
– For Alibaba and Taiwan Semiconductor Manufacturing, market cap data was taken from YCharts.
– When looking at the world’s richest people, we excluded David Koch, who passed away after the Forbes list was published, as well as Françoise Bettencourt Meyers and Beate Heister & Karl Albrecht Jr. who each inherited their fortunes less than five years ago and therefore there was not enough data to calculate an average rate of growth.
Full/More Story at Source
The Trillion Dollar Club | Comparisun

What makes a trillion dollar company?
The race to become the world’s first trillion dollar company was won by Apple back in 2018. Since then the likes of Microsoft, Amazon and Google’s parent company Alphabet have joined the exclusive club.
But the world’s biggest listed companies didn’t achieve their accolades by accident. So, what does make a trillion dollar company?
As always, keep in mind the value of investments can go down as well as up, so you could get back less than you invest.
Same lemon. More juice.
Most of the US tech giants have high levels of what’s known as operating leverage. Sounds a bit jargon heavy, but bear with me.
A company with a high degree of operating leverage is able to generate more profit from each additional sale, because it doesn’t have to significantly increase costs to produce that extra revenue. That’s achieved from having a mostly fixed cost base, which can sustain an increase in demand without needing to be “dialled up”. This type of company will see gross margins (revenue minus the cost of goods sold) increase as sales increase.
Software companies are a classic example of this kind of company. Developing high-tech software is a very expensive undertaking, but once built, adding a new customer is essentially free.
That’s a concept Microsoft knows all about.
Microsoft’s early success was built on the Windows operating system, launched back in 1985. Getting things off the ground didn’t come cheap, but once up and running each new Microsoft Office customer is almost pure profit. That helps support a gross profit margin of over 66%.
And Microsoft isn’t the only one putting this operating model to good use. Apple’s services business, including the App Store and Apple Music, has the same benefits. Over at Google, its search business is able to service new customers with few raising costs for the same reason.
It’s worth noting though that this kind of operating model is only good news if things are going well. If sales struggle or dramatically slow for any reason, having a big fixed cost base becomes more burdensome.
See the latest Microsoft share price, charts and how to trade
See the latest Alphabet share price, charts and how to trade
iHoard
Not only are these companies hugely profitable, but they’re quite capital light, which keeps investment requirements low. That means more of that profit can drop straight through into tangible cash.
The amount the tech giants can generate is pretty staggering. Amazon announced in the third quarter it generated $23.5bn of free cash in the previous 12 months. And strong cash generation means a lot of these companies are sitting on huge piles of accumulated cash – at the time of writing Alphabet is sitting on $105bn of the green stuff.
A big cash reserve offers an attractive layer of protection if things were to get tough. But it also raises some questions.
Forecast full year net cash position ($bn)
Source: Refinitiv Eikon 23 January 2020
We’d argue no company needs to be hoarding that much, and it doesn’t represent the best use of investors’ capital. Some are trying to fix that – Apple used some of its cash by launching a mammoth share buyback scheme, returning $139.6bn to shareholders over 2018 and 2019. But as the chart shows, it’s still sitting on a sizeable nest egg.
See the latest Apple share price, charts and how to trade
See the latest Amazon share price, charts and how to trade
Head in the clouds
One benefit of all that cash is it allows these companies to try their hand at different things. Giving them a strong competitive advantage when it comes to adapting to change.
That’s driven Alphabet to invest in side-projects like Waymo, which is a self-driving car business. It’s a small part of the operation, but could be very lucrative in the future. And with so much stashed away it won’t break the bank if these “other bets” don’t work out.
Similarly Microsoft has branched into the complex but lucrative world of cloud computing in more recent years, as personal computing revenues account for a shrinking portion of revenues. Azure, Microsoft’s flagship cloud business, saw revenues grow 63% in the first quarter of this year.
Fast growing yes, but it’s also costing a lot. Capital expenditure is likely to stretch past $16bn this year. And Microsoft isn’t alone in this sphere, Amazon has a mushrooming web services business, and Google’s making a go of it too.
Proportion of Microsoft cloud revenue to total revenue (%)
Source: Refinitiv Eikon 24 January 2020
Five star rating
Unsurprisingly companies with such positive characteristics are highly valued. In other words, investors are willing to pay a lot for each $1 of profits, as measured by a price to earnings (P/E) ratio.
High growth companies tend to have higher P/E ratios, because they’re expected to increase profits more quickly than others in the future. For that reason, a lot of the big tech companies have fairly lofty valuations. Amazon for example has a P/E of 68.1, which is lower than it’s been in the past, but much higher than the US market average.
That’s a sign of confidence from the market, but it does also mean the share price can be sensitive to a fall if growth disappoints.
What does this all mean?
There’s a lot of factors which have to line up for a business to get as big as the giants we’ve looked at here. But, crucially, they need to boast slick operating models and stellar cash generation, which enables them to hop over one of the biggest barriers to entry to new markets and products.
In turn that means they can tap into new ways to potentially make more profits, and the cycle can continue, although past performance isn’t a guide to the future.
It’s good practice to take note of things like operating model, cash position and valuation when considering an investment, but they’re not the whole story. These are all factors we explore in our share research, and you can sign up here.
Remember, if you’re unsure if an investment is right for you please seek advice.
Subscribe to our share research and results updates
Unless otherwise stated estimates, including prospective yields, are a consensus of analyst forecasts provided by Thomson Reuters. These estimates are not a reliable indicator of future performance. Yields are variable and not guaranteed. Past performance is not a guide to the future. Investments rise and fall in value so investors could make a loss.
This article is not advice or a recommendation to buy, sell or hold any investment. No view is given on the present or future value or price of any investment, and investors should form their own view on any proposed investment. This article has not been prepared in accordance with legal requirements designed to promote the independence of investment research and is considered a marketing communication. Non-independent research is not subject to FCA rules prohibiting dealing ahead of research, however HL has put controls in place (including dealing restrictions, physical and information barriers) to manage potential conflicts of interest presented by such dealing. Please see our full non-independent research disclosure for more information.
Share insight: our weekly email
Sign up to receive weekly shares content from HL
Please correct the following errors before you continue:
Existing client? Please log in to your account to automatically fill in the details below.
Title:Please select…MrMrsMissMsMxDrSirRev
First name:Last name:Email address:Main phone number: (optional)Mobile phone number: (optional)Date of birth: (optional) Title:First name:Last name:Address:Email address:
Your postcode ends:
Not your postcode? Enter your full address.
Hargreaves Lansdown PLC group companies will usually send you further information by post and/or email about our products and services. If you would prefer not to receive this, please do let us know. We will not sell or trade your personal data.
Full/More Story at Source
What makes a trillion dollar company?

Trillion-Dollar Market Cap Club
There are a handful of stocks in which institutions and individual investors have recently piled into. This behavior is emblematic of all bull markets once they begin to hit the manic phase. Wall Street falls in love with a few high-growth darlings and takes their valuations up to the thermosphere.
If you add up the market capitalizations of just four stocks, Google (Alphabet), Apple, Microsoft, and Amazon, their combined worth exceeds $5 trillion. If you throw in Facebook, you get the top 5 biggest firms by market capitalization, and they compose an amazing 18% of the S&P 500. Another way of looking at this is that the market cap of a full 282 companies in the S&P 500 now equals the same as the top 5 behemoths.
Again, this is not dissimilar to what has occurred in past blow-off tops. Recall the NASDAQ internet craze in the late ’90s and the Nifty Fifty bubble mania of the late ’60s and early ’70s. In the 694 days between January 11th, 1973, and December 6th, 1974, the Dow Jones Industrial Average lost over 45% of its value, but many stocks in the Nifty Fifty fared much worse. The Dot.com disaster was even more dramatic. It caused 5 trillion dollars of equity to vanish and wiped-out nearly 80% of market value.
The Nifty 50 stocks were the fastest-growing companies on the planet in the latter half of the 1960s and became known as “one-decision” stocks. These were viable companies with real business models but became extremely over-priced and over-owned. Investors were lulled into the belief they could buy and hold this group of stocks forever. By 1972, the overall S&P 500 Index’s P/E stood at 19. However, the Nifty Fifty’s average P/E at that time was more than twice that at 42. When the inevitable crash arrived, stocks that were part of the Nifty Fifty fell much more than the overall market. For example, by the end of ’74, Xerox fell 71 percent, while Avon and Polaroid plunged by 86 percent and 91 percent, respectively.
The years 1994 to 2000 marked a period of massive growth in the adoption of the internet, leading to a massive bubble in equities surrounding this technological revolution. This fostered an environment where investors overlooked traditional metrics, such as the price-earnings ratio. During this period, the Nasdaq Composite Index rose 400%, as its PE ratio soared to 200.
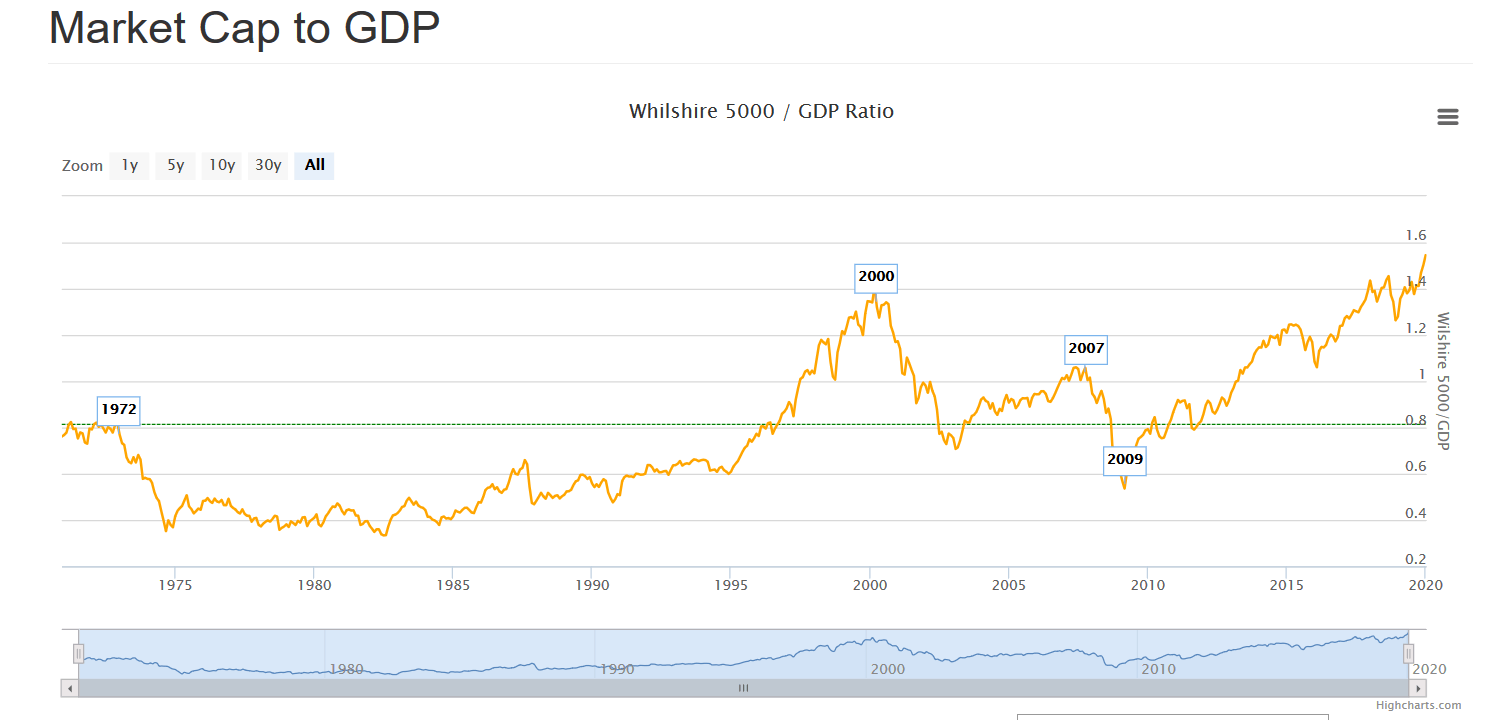
It’s always the same story: near the end of a massive bull market, a relatively small number of stocks get taken to incredible heights by a public that is thirsty for some story to justify such lofty valuations that are far above fundamentals. This can be clearly proved by viewing the Market capitalization of the Wilshire 5000 as a percentage of GDP. Stock valuations have now reached at an all-time high. In fact, they are nearly twice as high as the historical average and even higher than the NASDAQ bubble peak!
Not only this, but there are a record number of IPOs that don’t make any money, and a near-record number of U.S. listed companies that are spewing red ink—just like in past bubble tops.
This particular iteration of a massive equity bubble has seen a huge turn towards passive investments and a surge of money going into ETFs.
A paper done by the Federal Reserve explains that passive funds in 2018 now account for 39 percent of the combined U.S. Mutual Fund and ETF assets under management, up from just 3 percent in 1995 and 14 percent in 2005. According to the paper, passive investing is pushing up the prices of index constituents and there is a risk that rising prices can lead to more indexed investing, and the resulting “index bubble” eventually could burst.
This brings us to a potentially huge problem with the overall market. A study done by Factset shows that in some instances of the largest market cap stocks that are held within ETFs, they represent more than 30 days of the average daily trading volume of the individual security that is traded on the exchanges. This means, for example, if only 10% of ETF holders decide to sell the security on any given day, it will represent three times the entire volume that is traded on the NYSE. Therefore, what we have is a condition where investors have become overcrowded in a few positions–just like what has occurred in previous market tops. However, this time around the situation is compounded by an influx of new money that has piled into ETFs. These same investments have doubled down on the doomed strategy of piling into a handful of winners.
In 2008 there was just $700 billion invested in ETFs; today, there is just under $5 trillion. ETFs have greatly exacerbated market directions in the past. Their existence tends to propel bull markets higher but, on the flip side, they also have led to flash crashes. To fully understand the dangers associated with buying and holding ETFs—and the overall market in general, especially in a bear market–you have to understand the process of creation and redemption units and how Authorized Participants (AP) function.
APs are the only entities that are allowed to directly interact with an ETF provider in order to create and redeem units. During a bull market, an ETF often trades at a premium to the underlying securities held by the index it tracks. In this case, an AP can buy the individual shares on the index at a discount and exchange them for a new ETF that is trading in the market at a higher price and then sells the ETF in the market for a profit. This process is known as creation, which adds to the supply of ETFs. And, it perpetuates the bull run.
Conversely, during market panics, an ETF will often sell at a steep discount to the shares trading on the index. In this case, an AP can buy the ETF in the market and exchange it for the individual shares on the index from the provider that is trading at a higher price. The AP can then sell the individual shares on the open market. This process is called redemption, and it reduces the number of ETF units. However, this process has also exacerbated crashes in the past by adding more selling pressure on to the individual shares of the index, which in turn leads to more panic selling for the less liquid ETF market.
Who are these very few lucky and privileged Authorized Participants? You may have guessed it, large banks such as; JP Morgan, Goldman Sachs, and Morgan Stanley.
This is just one more reason that validates the necessity of having a process that identifies when the epoch bear market begins before one occurs…because the next bear market should be one that makes the Great Recession of 2008 seem benign in comparison.
Full/More Story at Source
Trillion-Dollar Market Cap Club

China’s Trillion-Dollar Market Promise Beckons Wealth Firms
LISTEN TO ARTICLE
5:38
SHARE THIS ARTICLE

Photographer: Johannes Eisele/AFP via Getty Images
Sign up here for our daily coronavirus newsletter on what you need to know, and subscribe to our Covid-19 podcast for the latest news and analysis.
China’s trillion dollar asset-management market opens wider this week, forcing BlackRock Inc., Vanguard Group Inc. and other global firms to make a strategic decision: Go it alone or work with an entrenched local partner.
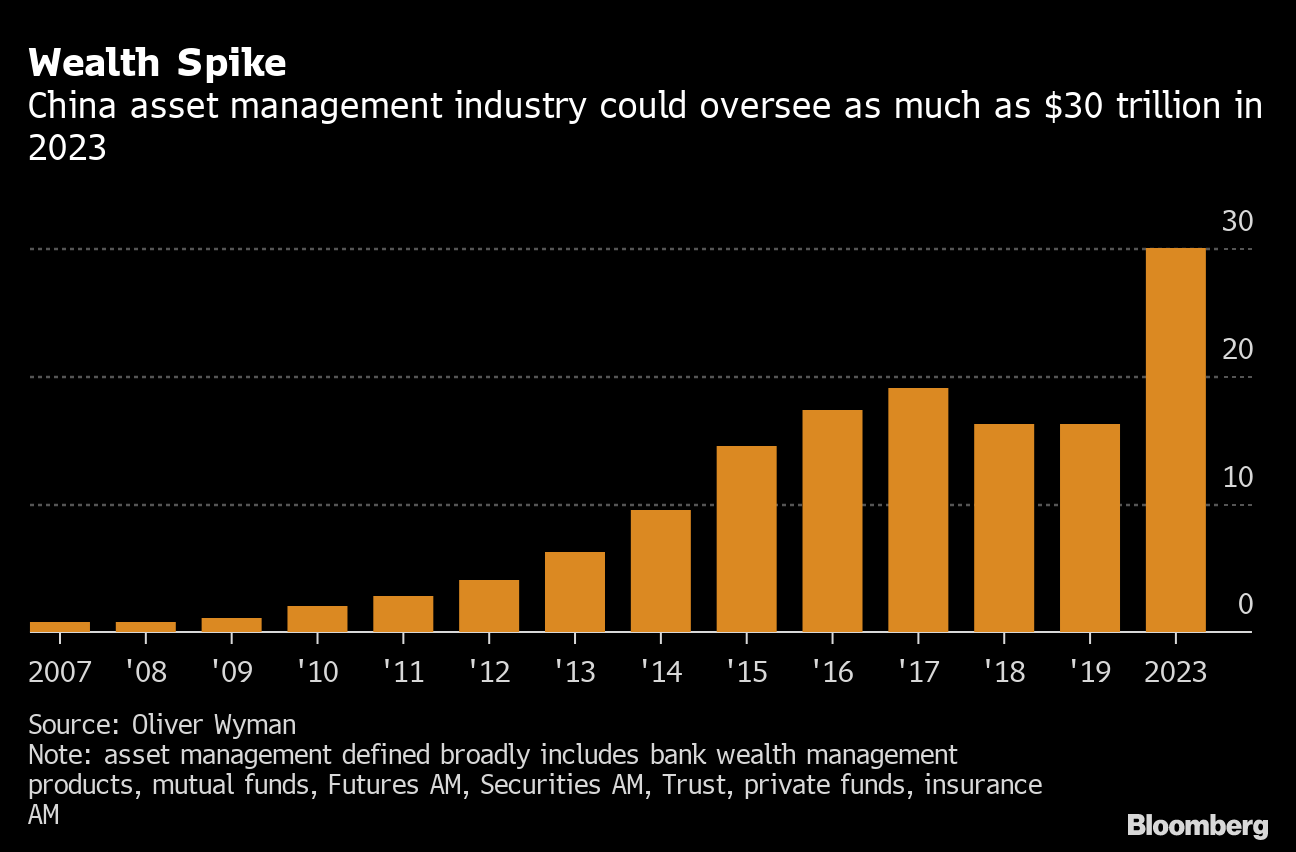
While the further liberalization of the investment banking and money management industries in China has been overshadowed by the coronavirus crisis, wealth firms are nonetheless laying out plans to tap an overall market poised to reach $30 trillion in assets by 2023, according to consultant Oliver Wyman. For retail public funds alone, the market could reach $3.4 trillion over the same period, says Deloitte LLP.
Read more about how China is dismantling its financial walls
Starting April 1, money managers can apply for licenses to set up wholly-owned mutual fund firms for the first time. Vanguard and BlackRock are among firms going that route, people familiar have said. Other options include boosting ownership of existing joint venture partnerships to 100%, as JPMorgan Chase & Co. plans to do, people familiar have said.
“With so many license options and changing policies, one of the biggest questions all foreign players face is where to allocate their resources,” said Jasper Yip, a principal in the financial services practice at Oliver Wyman in Hong Kong. “Asset management could be one of the most competitive sectors because of the opportunities.”
Wealth Spike
China asset management industry could oversee as much as $30 trillion in 2023
Source: Oliver Wyman
Note: asset management defined broadly includes bank wealth management products, mutual funds, Futures AM, Securities AM, Trust, private funds, insurance AM
Here are the different paths asset managers can pursue in China and how some of them plan to proceed:
Wealth Management Subsidiaries
The China Banking and Insurance Regulatory Commission has been encouraging foreign asset managers to work with the wealth management subsidiaries of Chinese banks or insurers. Global players are expected to bring to the table product design expertise, while the Chinese firms provide a vast distribution network and relationship managers.
BlackRock is in talks with China Construction Bank Corp. to set up a joint venture for a wealth management subsidiary, according to people familiar with the matter. Goldman Sachs Group Inc. has discussed a similar structure, people familiar have said.
“Chinese banks have great distribution channels and client relationships, but many of them lack expertise to create long-term investment products with sufficient risk controls, so they would benefit from working with foreign players,” said Harry Qin, a partner at PricewaterhouseCoopers LLP in Beijing.
Wholly-Owned Companies
This is the go-it-alone option. China is planning to allow applications for foreign-owned fund management licenses that would grant control of mutual funds. At least six firms, including BlackRock and Vanguard, have told regulators they intend to apply to the Chinese securities watchdog, people familiar with the matter have said.
China regulators are trying to shift consumers away from shadow banking products underpinned by loans sitting outside banks’ balance sheets. That’s creating an opportunity for mutual funds that are expected to increase assets by more than 10% annually, according to Oliver Wyman, a unit of New York-based Marsh & McLennan Cos.
The fund management licenses will allow global asset managers to sell mutual funds to individual investors. Some firms already hold private asset management licenses that let them target institutional investors and high-net-worth individuals, much like hedge funds.

“Wholly-owned fund management licenses will be one of the most sought after options for foreign companies,” said Rachel Wang, director of manager research for China at Morningstar Inc. “It allows them to offer more products and have a wide outreach to different types or sizes of customers.”
The potential is significant. Even with the market opening, foreign players are expected to only account for 6% of revenue generated in the asset management space by 2023, according to Oliver Wyman. Still, that small piece of the market could be worth $8 billion.
“Chinese regulators are very eager to attract foreign players in the financial sector,” said James Chang, China consulting leader at PricewaterhouseCoopers. “The government thinks the market is big enough for the local players to handle the competition.”
Joint Ventures
This is the legacy option. Several investment banks already have mutual fund joint ventures in China. With foreign companies now free to control operations on the ground, it’s unclear whether partnerships still provide value.
“Many of the joint venture asset management firms that foreign players set up with their Chinese counterparts have not been performing as expected, partly due to limited product offerings and less than ideal collaboration with the Chinese brokerages,” said Qin from PwC.
The solution for some is to buy out their partners. JPMorgan is seeking 100% ownership of its fund management joint venture, people familiar have said. The New York-based bank is in talks with Shanghai International Trust Co. to acquire its stake in China International Fund Management, which oversees 150 billion yuan ($21 billion).
Vanguard meanwhile has a robo-advisory joint venture with Jack Ma’s Ant Financial Services Group that started providing mutual-fund recommendations to Alipay app users in late March.
JPMorgan Is Said to Seek Full Control of China Fund Venture
| Joint Venture Stakes | |
|---|---|
| Morgan Stanley | 48% |
| JPMorgan | 51% |
| UBS | 49% |
| Credit Suisse | 20% |
| Deutsche Bank | 30% |
| BlackRock | 16.5% |
| HSBC | 49% |
Private Funds
A go-slow approach. Foreign companies were first allowed to apply for private fund licenses in 2016. Some 25 firms, ranging from banks to hedge funds and insurance companies, have won these licenses, according to Natasha Xie, a Shanghai-based partner at the JunHe law firm.
The private funds run three types of assets: stocks, private equity and pilot programs introduced by the Shanghai and Shenzhen governments that allow global asset managers to raise yuan-denominated funds from qualified clients to invest overseas.
“It would make sense for players who can’t commit significant investment or headcount to apply for the private fund management license,” said Xie.
(Updates with potential size of retail fund market in second paragraph)
Have a confidential tip for our reporters?
GET IN TOUCH
Before it’s here, it’s on the Bloomberg Terminal.
LEARN MORELISTEN TO ARTICLE
5:38
SHARE THIS ARTICLE
Full/More Story at Source
China’s Trillion-Dollar Market Promise Beckons Wealth Firms

Trillion-dollar club tightens grip on fund market during crisis
Multi-trillion dollar managers including BlackRock, Vanguard, State Street and Fidelity tightened their stranglehold on the investment industry during the recent market correction, as jittery investors accelerated their migration towards large, low-cost fund groups.
The concentration of assets in the hands of the largest investment managers, a trend that has been gathering pace since the 2008 financial crisis, spiked significantly in the first three months of the year, according to analysis from US-based research group Flowspring.
The largest 1 per cent of investment groups manage 61 per cent of total industry assets. This is 243 times that of the bottom 50 per cent, compared with 208 times at the end of last year and 105 in 2010.
“Investors are reconsidering everything about their portfolios right now, making decisions they’ve put off for years, and many of them are flocking to passive and low-cost providers,” said Warren Miller, chief executive of Flowspring.
Market leaders BlackRock, Vanguard, State Street and Fidelity in recent years have capitalised on their economies of scale to implement ferocious fee cuts. These efforts have attracted new investors.
In 2018, Fidelity Investments pioneered a range of zero-fee index funds, a move that spurred a flood of new investor money. More recently the US group launched a range of thematic active funds whose charges decrease over time if investors do not cash out.
Vanguard slashed fees on nearly half its European fund range last year, while BlackRock and State Street have also reduced charges on their index-tracking funds in an escalating passive investing price war.
Quantitative investment specialist Dimensional, bond giant Pimco and American Funds, the retail arm of Capital Group, also feature among the 27 groups that make up the 1 per cent of asset managers, according to Flowspring. Fidelity’s inclusion in the ranking refers to US-based Fidelity Investments, combined with its international sister companies.
The research company’s calculation is based on a universe of 2,772 managers and includes data for open-ended, closed-ended and exchange traded funds globally.
Mr Miller said that concentration was also accelerating at fund level, with investors channelling more money into large, low-cost, predominantly passive funds. “We’ve seen investors buck the idea that active managers can outperform in a downturn,” he said.
Seven out of the 10 largest global funds, including money market funds, are index trackers, according to Morningstar Direct. Two of the largest, Vanguard’s Total Stock Market index fund and State Street’s S&P 500 ETF Trust, attracted more than $24bn in new money in March.
Industry concentration is set to increase as margin pressures and the desire for scale push more asset managers to take part in M&A. Franklin Templeton is in the process of buying Legg Mason in a deal that will swell its asset base to $1.5tn. Invesco also shot into the trillion-dollar club last year following its mega $5.7bn acquisition of OppenheimerFunds.
Mr Miller warned that the concentration of assets in the hands of fewer decision makers could increase baseline market volatility in future. He added: “It could also make the heads of the largest asset managers incredibly powerful influencers of the global economy as they can exert serious pressure on their portfolio companies.”
Groups are already making their voices heard. This year both BlackRock and State Street wrote to chief executives warning them to take sustainability seriously.
Full/More Story at Source
Trillion-dollar club tightens grip on fund market during crisis
Add Story/ Your Say
[*Select Category/Tag: Think Trillion at Your Next Publish Screen.]
The Trillion Dollar Club | Comparisun
The Trillion Dollar Club | Comparisun
At Comparisun, we’re here to help you find the best POS system, the best credit card processing company or the best payroll service, but we’re also known to take the time to launch studies into the wider business sector every month.
Microsoft recently became the latest company to join Wall Street’s exclusive ‘Trillion Dollar Club’, after reaching a market capitalization of a trillion dollars in late April.
They join both Apple and Amazon, who have both seen great growth in recent years (although Amazon has slightly dropped below the $1 trillion threshold again at the moment).
And while no individuals are yet to amass a fortune of a trillion dollars, Jeff Bezos is the first to hit the $100 billion mark and could be the world’s first trillionaire sooner than you’d think.
We’ve analysed historical valuations of some of the world’s richest companies and individuals in an attempt to predict when they’ll join the Trillion Dollar Club.
Which companies will be the first to join the Trillion Dollar Club?
Google look set to join their fellow tech giants Apple and Microsoft in hitting the $1 trillion mark within the next year (as will Amazon, who have hit the threshold in the past but have briefly dropped out again).
The numbers suggest that they’ll soon be followed by the last of the Big Four tech companies, Facebook, whose market cap currently sits at around $665bn, but has seen an average growth of 24% over the last five years, which, if continued, could see them join the club in 2022.
Next in line would be Warren Buffet’s Berkshire Hathway conglomerate and financial services provider Visa who could both hit $1 trillion valuations by 2023.
Predicting the world’s first trillionaires
Despite losing an estimated $38 billion as part of his recent divorce, Jeff Bezos is still by far the world’s richest person and his net worth has grown by 34% on average over the last five years, which could potentially see him become the world’s first trillionaire as early as 2026, at which point he’ll be aged 62.
While he might have to wait a couple of extra years, Facebook founder Mark Zuckerberg could gain trillionaire status at a younger age than Bezos, as his current rate growth would see him worth $1 trillion aged 51.
Of the 25 individuals we analysed, only eleven realistically have a chance of becoming a trillionaire during their lifetime, based on their recent rate of wealth growth.
Methodology
We analysed the market capitalization of the 25 highest valued companies on the New York Stock Exchange according to Macrotrends, as well as the net worth of the richest 25 people in the world, according to Forbes, in both cases taking the last five years of data (as of September 16th).
For both, we then calculated the average yearly % growth over the last five years and applied this rate of growth for each future year to try and predict how the value will change.
Notes:
– For Google, Berkshire Hathaway and Royal Dutch Shell, who have each split their stocks into more than one group of shares, we took the one with the highest value as of September 16th.
– For Alibaba and Taiwan Semiconductor Manufacturing, market cap data was taken from YCharts.
– When looking at the world’s richest people, we excluded David Koch, who passed away after the Forbes list was published, as well as Françoise Bettencourt Meyers and Beate Heister & Karl Albrecht Jr. who each inherited their fortunes less than five years ago and therefore there was not enough data to calculate an average rate of growth.
Full/More Story at Source
The Trillion Dollar Club | Comparisun
What makes a trillion dollar company?
What makes a trillion dollar company?
The race to become the world’s first trillion dollar company was won by Apple back in 2018. Since then the likes of Microsoft, Amazon and Google’s parent company Alphabet have joined the exclusive club.
But the world’s biggest listed companies didn’t achieve their accolades by accident. So, what does make a trillion dollar company?
As always, keep in mind the value of investments can go down as well as up, so you could get back less than you invest.
Same lemon. More juice.
Most of the US tech giants have high levels of what’s known as operating leverage. Sounds a bit jargon heavy, but bear with me.
A company with a high degree of operating leverage is able to generate more profit from each additional sale, because it doesn’t have to significantly increase costs to produce that extra revenue. That’s achieved from having a mostly fixed cost base, which can sustain an increase in demand without needing to be “dialled up”. This type of company will see gross margins (revenue minus the cost of goods sold) increase as sales increase.
Software companies are a classic example of this kind of company. Developing high-tech software is a very expensive undertaking, but once built, adding a new customer is essentially free.
That’s a concept Microsoft knows all about.
Microsoft’s early success was built on the Windows operating system, launched back in 1985. Getting things off the ground didn’t come cheap, but once up and running each new Microsoft Office customer is almost pure profit. That helps support a gross profit margin of over 66%.
And Microsoft isn’t the only one putting this operating model to good use. Apple’s services business, including the App Store and Apple Music, has the same benefits. Over at Google, its search business is able to service new customers with few raising costs for the same reason.
It’s worth noting though that this kind of operating model is only good news if things are going well. If sales struggle or dramatically slow for any reason, having a big fixed cost base becomes more burdensome.
See the latest Microsoft share price, charts and how to trade
See the latest Alphabet share price, charts and how to trade
iHoard
Not only are these companies hugely profitable, but they’re quite capital light, which keeps investment requirements low. That means more of that profit can drop straight through into tangible cash.
The amount the tech giants can generate is pretty staggering. Amazon announced in the third quarter it generated $23.5bn of free cash in the previous 12 months. And strong cash generation means a lot of these companies are sitting on huge piles of accumulated cash – at the time of writing Alphabet is sitting on $105bn of the green stuff.
A big cash reserve offers an attractive layer of protection if things were to get tough. But it also raises some questions.
Forecast full year net cash position ($bn)
Source: Refinitiv Eikon 23 January 2020
We’d argue no company needs to be hoarding that much, and it doesn’t represent the best use of investors’ capital. Some are trying to fix that – Apple used some of its cash by launching a mammoth share buyback scheme, returning $139.6bn to shareholders over 2018 and 2019. But as the chart shows, it’s still sitting on a sizeable nest egg.
See the latest Apple share price, charts and how to trade
See the latest Amazon share price, charts and how to trade
Head in the clouds
One benefit of all that cash is it allows these companies to try their hand at different things. Giving them a strong competitive advantage when it comes to adapting to change.
That’s driven Alphabet to invest in side-projects like Waymo, which is a self-driving car business. It’s a small part of the operation, but could be very lucrative in the future. And with so much stashed away it won’t break the bank if these “other bets” don’t work out.
Similarly Microsoft has branched into the complex but lucrative world of cloud computing in more recent years, as personal computing revenues account for a shrinking portion of revenues. Azure, Microsoft’s flagship cloud business, saw revenues grow 63% in the first quarter of this year.
Fast growing yes, but it’s also costing a lot. Capital expenditure is likely to stretch past $16bn this year. And Microsoft isn’t alone in this sphere, Amazon has a mushrooming web services business, and Google’s making a go of it too.
Proportion of Microsoft cloud revenue to total revenue (%)
Source: Refinitiv Eikon 24 January 2020
Five star rating
Unsurprisingly companies with such positive characteristics are highly valued. In other words, investors are willing to pay a lot for each $1 of profits, as measured by a price to earnings (P/E) ratio.
High growth companies tend to have higher P/E ratios, because they’re expected to increase profits more quickly than others in the future. For that reason, a lot of the big tech companies have fairly lofty valuations. Amazon for example has a P/E of 68.1, which is lower than it’s been in the past, but much higher than the US market average.
That’s a sign of confidence from the market, but it does also mean the share price can be sensitive to a fall if growth disappoints.
What does this all mean?
There’s a lot of factors which have to line up for a business to get as big as the giants we’ve looked at here. But, crucially, they need to boast slick operating models and stellar cash generation, which enables them to hop over one of the biggest barriers to entry to new markets and products.
In turn that means they can tap into new ways to potentially make more profits, and the cycle can continue, although past performance isn’t a guide to the future.
It’s good practice to take note of things like operating model, cash position and valuation when considering an investment, but they’re not the whole story. These are all factors we explore in our share research, and you can sign up here.
Remember, if you’re unsure if an investment is right for you please seek advice.
Subscribe to our share research and results updates
Unless otherwise stated estimates, including prospective yields, are a consensus of analyst forecasts provided by Thomson Reuters. These estimates are not a reliable indicator of future performance. Yields are variable and not guaranteed. Past performance is not a guide to the future. Investments rise and fall in value so investors could make a loss.
This article is not advice or a recommendation to buy, sell or hold any investment. No view is given on the present or future value or price of any investment, and investors should form their own view on any proposed investment. This article has not been prepared in accordance with legal requirements designed to promote the independence of investment research and is considered a marketing communication. Non-independent research is not subject to FCA rules prohibiting dealing ahead of research, however HL has put controls in place (including dealing restrictions, physical and information barriers) to manage potential conflicts of interest presented by such dealing. Please see our full non-independent research disclosure for more information.
Share insight: our weekly email
Sign up to receive weekly shares content from HL
Please correct the following errors before you continue:
Existing client? Please log in to your account to automatically fill in the details below.
Title:Please select…MrMrsMissMsMxDrSirRev
First name:Last name:Email address:Main phone number: (optional)Mobile phone number: (optional)Date of birth: (optional) Title:First name:Last name:Address:Email address: Your postcode ends:
Not your postcode? Enter your full address.
Hargreaves Lansdown PLC group companies will usually send you further information by post and/or email about our products and services. If you would prefer not to receive this, please do let us know. We will not sell or trade your personal data.
Full/More Story at Source
What makes a trillion dollar company?
Trillion-Dollar Market Cap Club
Trillion-Dollar Market Cap Club
There are a handful of stocks in which institutions and individual investors have recently piled into. This behavior is emblematic of all bull markets once they begin to hit the manic phase. Wall Street falls in love with a few high-growth darlings and takes their valuations up to the thermosphere.
If you add up the market capitalizations of just four stocks, Google (Alphabet), Apple, Microsoft, and Amazon, their combined worth exceeds $5 trillion. If you throw in Facebook, you get the top 5 biggest firms by market capitalization, and they compose an amazing 18% of the S&P 500. Another way of looking at this is that the market cap of a full 282 companies in the S&P 500 now equals the same as the top 5 behemoths.
Again, this is not dissimilar to what has occurred in past blow-off tops. Recall the NASDAQ internet craze in the late ’90s and the Nifty Fifty bubble mania of the late ’60s and early ’70s. In the 694 days between January 11th, 1973, and December 6th, 1974, the Dow Jones Industrial Average lost over 45% of its value, but many stocks in the Nifty Fifty fared much worse. The Dot.com disaster was even more dramatic. It caused 5 trillion dollars of equity to vanish and wiped-out nearly 80% of market value.
The Nifty 50 stocks were the fastest-growing companies on the planet in the latter half of the 1960s and became known as “one-decision” stocks. These were viable companies with real business models but became extremely over-priced and over-owned. Investors were lulled into the belief they could buy and hold this group of stocks forever. By 1972, the overall S&P 500 Index’s P/E stood at 19. However, the Nifty Fifty’s average P/E at that time was more than twice that at 42. When the inevitable crash arrived, stocks that were part of the Nifty Fifty fell much more than the overall market. For example, by the end of ’74, Xerox fell 71 percent, while Avon and Polaroid plunged by 86 percent and 91 percent, respectively.
The years 1994 to 2000 marked a period of massive growth in the adoption of the internet, leading to a massive bubble in equities surrounding this technological revolution. This fostered an environment where investors overlooked traditional metrics, such as the price-earnings ratio. During this period, the Nasdaq Composite Index rose 400%, as its PE ratio soared to 200.
It’s always the same story: near the end of a massive bull market, a relatively small number of stocks get taken to incredible heights by a public that is thirsty for some story to justify such lofty valuations that are far above fundamentals. This can be clearly proved by viewing the Market capitalization of the Wilshire 5000 as a percentage of GDP. Stock valuations have now reached at an all-time high. In fact, they are nearly twice as high as the historical average and even higher than the NASDAQ bubble peak!
Not only this, but there are a record number of IPOs that don’t make any money, and a near-record number of U.S. listed companies that are spewing red ink—just like in past bubble tops.
This particular iteration of a massive equity bubble has seen a huge turn towards passive investments and a surge of money going into ETFs.
A paper done by the Federal Reserve explains that passive funds in 2018 now account for 39 percent of the combined U.S. Mutual Fund and ETF assets under management, up from just 3 percent in 1995 and 14 percent in 2005. According to the paper, passive investing is pushing up the prices of index constituents and there is a risk that rising prices can lead to more indexed investing, and the resulting “index bubble” eventually could burst.
This brings us to a potentially huge problem with the overall market. A study done by Factset shows that in some instances of the largest market cap stocks that are held within ETFs, they represent more than 30 days of the average daily trading volume of the individual security that is traded on the exchanges. This means, for example, if only 10% of ETF holders decide to sell the security on any given day, it will represent three times the entire volume that is traded on the NYSE. Therefore, what we have is a condition where investors have become overcrowded in a few positions–just like what has occurred in previous market tops. However, this time around the situation is compounded by an influx of new money that has piled into ETFs. These same investments have doubled down on the doomed strategy of piling into a handful of winners.
In 2008 there was just $700 billion invested in ETFs; today, there is just under $5 trillion. ETFs have greatly exacerbated market directions in the past. Their existence tends to propel bull markets higher but, on the flip side, they also have led to flash crashes. To fully understand the dangers associated with buying and holding ETFs—and the overall market in general, especially in a bear market–you have to understand the process of creation and redemption units and how Authorized Participants (AP) function.
APs are the only entities that are allowed to directly interact with an ETF provider in order to create and redeem units. During a bull market, an ETF often trades at a premium to the underlying securities held by the index it tracks. In this case, an AP can buy the individual shares on the index at a discount and exchange them for a new ETF that is trading in the market at a higher price and then sells the ETF in the market for a profit. This process is known as creation, which adds to the supply of ETFs. And, it perpetuates the bull run.
Conversely, during market panics, an ETF will often sell at a steep discount to the shares trading on the index. In this case, an AP can buy the ETF in the market and exchange it for the individual shares on the index from the provider that is trading at a higher price. The AP can then sell the individual shares on the open market. This process is called redemption, and it reduces the number of ETF units. However, this process has also exacerbated crashes in the past by adding more selling pressure on to the individual shares of the index, which in turn leads to more panic selling for the less liquid ETF market.
Who are these very few lucky and privileged Authorized Participants? You may have guessed it, large banks such as; JP Morgan, Goldman Sachs, and Morgan Stanley.
This is just one more reason that validates the necessity of having a process that identifies when the epoch bear market begins before one occurs…because the next bear market should be one that makes the Great Recession of 2008 seem benign in comparison.
Full/More Story at Source
Trillion-Dollar Market Cap Club
China’s Trillion-Dollar Market Promise Beckons Wealth Firms
China’s Trillion-Dollar Market Promise Beckons Wealth Firms
LISTEN TO ARTICLE
5:38
SHARE THIS ARTICLE
Photographer: Johannes Eisele/AFP via Getty Images
Sign up here for our daily coronavirus newsletter on what you need to know, and subscribe to our Covid-19 podcast for the latest news and analysis.
China’s trillion dollar asset-management market opens wider this week, forcing BlackRock Inc., Vanguard Group Inc. and other global firms to make a strategic decision: Go it alone or work with an entrenched local partner.
While the further liberalization of the investment banking and money management industries in China has been overshadowed by the coronavirus crisis, wealth firms are nonetheless laying out plans to tap an overall market poised to reach $30 trillion in assets by 2023, according to consultant Oliver Wyman. For retail public funds alone, the market could reach $3.4 trillion over the same period, says Deloitte LLP.
Read more about how China is dismantling its financial walls
Starting April 1, money managers can apply for licenses to set up wholly-owned mutual fund firms for the first time. Vanguard and BlackRock are among firms going that route, people familiar have said. Other options include boosting ownership of existing joint venture partnerships to 100%, as JPMorgan Chase & Co. plans to do, people familiar have said.
“With so many license options and changing policies, one of the biggest questions all foreign players face is where to allocate their resources,” said Jasper Yip, a principal in the financial services practice at Oliver Wyman in Hong Kong. “Asset management could be one of the most competitive sectors because of the opportunities.”
Wealth Spike
China asset management industry could oversee as much as $30 trillion in 2023
Source: Oliver Wyman
Note: asset management defined broadly includes bank wealth management products, mutual funds, Futures AM, Securities AM, Trust, private funds, insurance AM
Here are the different paths asset managers can pursue in China and how some of them plan to proceed:
Wealth Management Subsidiaries
The China Banking and Insurance Regulatory Commission has been encouraging foreign asset managers to work with the wealth management subsidiaries of Chinese banks or insurers. Global players are expected to bring to the table product design expertise, while the Chinese firms provide a vast distribution network and relationship managers.
BlackRock is in talks with China Construction Bank Corp. to set up a joint venture for a wealth management subsidiary, according to people familiar with the matter. Goldman Sachs Group Inc. has discussed a similar structure, people familiar have said.
“Chinese banks have great distribution channels and client relationships, but many of them lack expertise to create long-term investment products with sufficient risk controls, so they would benefit from working with foreign players,” said Harry Qin, a partner at PricewaterhouseCoopers LLP in Beijing.
Wholly-Owned Companies
This is the go-it-alone option. China is planning to allow applications for foreign-owned fund management licenses that would grant control of mutual funds. At least six firms, including BlackRock and Vanguard, have told regulators they intend to apply to the Chinese securities watchdog, people familiar with the matter have said.
China regulators are trying to shift consumers away from shadow banking products underpinned by loans sitting outside banks’ balance sheets. That’s creating an opportunity for mutual funds that are expected to increase assets by more than 10% annually, according to Oliver Wyman, a unit of New York-based Marsh & McLennan Cos.
The fund management licenses will allow global asset managers to sell mutual funds to individual investors. Some firms already hold private asset management licenses that let them target institutional investors and high-net-worth individuals, much like hedge funds.
“Wholly-owned fund management licenses will be one of the most sought after options for foreign companies,” said Rachel Wang, director of manager research for China at Morningstar Inc. “It allows them to offer more products and have a wide outreach to different types or sizes of customers.”
The potential is significant. Even with the market opening, foreign players are expected to only account for 6% of revenue generated in the asset management space by 2023, according to Oliver Wyman. Still, that small piece of the market could be worth $8 billion.
“Chinese regulators are very eager to attract foreign players in the financial sector,” said James Chang, China consulting leader at PricewaterhouseCoopers. “The government thinks the market is big enough for the local players to handle the competition.”
Joint Ventures
This is the legacy option. Several investment banks already have mutual fund joint ventures in China. With foreign companies now free to control operations on the ground, it’s unclear whether partnerships still provide value.
“Many of the joint venture asset management firms that foreign players set up with their Chinese counterparts have not been performing as expected, partly due to limited product offerings and less than ideal collaboration with the Chinese brokerages,” said Qin from PwC.
The solution for some is to buy out their partners. JPMorgan is seeking 100% ownership of its fund management joint venture, people familiar have said. The New York-based bank is in talks with Shanghai International Trust Co. to acquire its stake in China International Fund Management, which oversees 150 billion yuan ($21 billion).
Vanguard meanwhile has a robo-advisory joint venture with Jack Ma’s Ant Financial Services Group that started providing mutual-fund recommendations to Alipay app users in late March.
JPMorgan Is Said to Seek Full Control of China Fund Venture
| Joint Venture Stakes | |
|---|---|
| Morgan Stanley | 48% |
| JPMorgan | 51% |
| UBS | 49% |
| Credit Suisse | 20% |
| Deutsche Bank | 30% |
| BlackRock | 16.5% |
| HSBC | 49% |
Private Funds
A go-slow approach. Foreign companies were first allowed to apply for private fund licenses in 2016. Some 25 firms, ranging from banks to hedge funds and insurance companies, have won these licenses, according to Natasha Xie, a Shanghai-based partner at the JunHe law firm.
The private funds run three types of assets: stocks, private equity and pilot programs introduced by the Shanghai and Shenzhen governments that allow global asset managers to raise yuan-denominated funds from qualified clients to invest overseas.
“It would make sense for players who can’t commit significant investment or headcount to apply for the private fund management license,” said Xie.
(Updates with potential size of retail fund market in second paragraph)
Have a confidential tip for our reporters?
GET IN TOUCH
Before it’s here, it’s on the Bloomberg Terminal.
LEARN MORELISTEN TO ARTICLE
5:38
SHARE THIS ARTICLE
Full/More Story at Source
China’s Trillion-Dollar Market Promise Beckons Wealth Firms
Trillion-dollar club tightens grip on fund market during crisis
Trillion-dollar club tightens grip on fund market during crisis
Multi-trillion dollar managers including BlackRock, Vanguard, State Street and Fidelity tightened their stranglehold on the investment industry during the recent market correction, as jittery investors accelerated their migration towards large, low-cost fund groups.
The concentration of assets in the hands of the largest investment managers, a trend that has been gathering pace since the 2008 financial crisis, spiked significantly in the first three months of the year, according to analysis from US-based research group Flowspring.
The largest 1 per cent of investment groups manage 61 per cent of total industry assets. This is 243 times that of the bottom 50 per cent, compared with 208 times at the end of last year and 105 in 2010.
“Investors are reconsidering everything about their portfolios right now, making decisions they’ve put off for years, and many of them are flocking to passive and low-cost providers,” said Warren Miller, chief executive of Flowspring.
Market leaders BlackRock, Vanguard, State Street and Fidelity in recent years have capitalised on their economies of scale to implement ferocious fee cuts. These efforts have attracted new investors.
In 2018, Fidelity Investments pioneered a range of zero-fee index funds, a move that spurred a flood of new investor money. More recently the US group launched a range of thematic active funds whose charges decrease over time if investors do not cash out.
Vanguard slashed fees on nearly half its European fund range last year, while BlackRock and State Street have also reduced charges on their index-tracking funds in an escalating passive investing price war.
Quantitative investment specialist Dimensional, bond giant Pimco and American Funds, the retail arm of Capital Group, also feature among the 27 groups that make up the 1 per cent of asset managers, according to Flowspring. Fidelity’s inclusion in the ranking refers to US-based Fidelity Investments, combined with its international sister companies.
The research company’s calculation is based on a universe of 2,772 managers and includes data for open-ended, closed-ended and exchange traded funds globally.
Mr Miller said that concentration was also accelerating at fund level, with investors channelling more money into large, low-cost, predominantly passive funds. “We’ve seen investors buck the idea that active managers can outperform in a downturn,” he said.
Seven out of the 10 largest global funds, including money market funds, are index trackers, according to Morningstar Direct. Two of the largest, Vanguard’s Total Stock Market index fund and State Street’s S&P 500 ETF Trust, attracted more than $24bn in new money in March.
Industry concentration is set to increase as margin pressures and the desire for scale push more asset managers to take part in M&A. Franklin Templeton is in the process of buying Legg Mason in a deal that will swell its asset base to $1.5tn. Invesco also shot into the trillion-dollar club last year following its mega $5.7bn acquisition of OppenheimerFunds.
Mr Miller warned that the concentration of assets in the hands of fewer decision makers could increase baseline market volatility in future. He added: “It could also make the heads of the largest asset managers incredibly powerful influencers of the global economy as they can exert serious pressure on their portfolio companies.”
Groups are already making their voices heard. This year both BlackRock and State Street wrote to chief executives warning them to take sustainability seriously.
Full/More Story at Source
Trillion-dollar club tightens grip on fund market during crisis
*Above All Stories ON/ABOUT/FROM ‘Think Trillion‘ are Published/Edited/Enhanced randomly by the Global Open Profile: WerSzen.

~ MORE ~


EXPLORE S.

→ Story You’re Creating or Missing . . .
✐ Publish
????️????️ Perceive
???? Play
TrendingStory
SocialStory
RandomStory
